Spring River Report
Quick Summary
This winter delivered an average snowpack to the Eagle River Watershed (ERW), finishing just 0.7 inches below the historical median peak. However, unseasonably warm temperatures and a dry end to April have set the stage for accelerated snowmelt. As a result, the ERW is likely to experience an early and rapid runoff, with rivers and creeks peaking lower than in the past two years, and the snowpack melting out ahead of the historical average.
Update on May 9 – Most of Eagle County has now entered moderate drought.
*Please note, all data was pulled on May 5, some maps and graphs change every day*
Precipitation
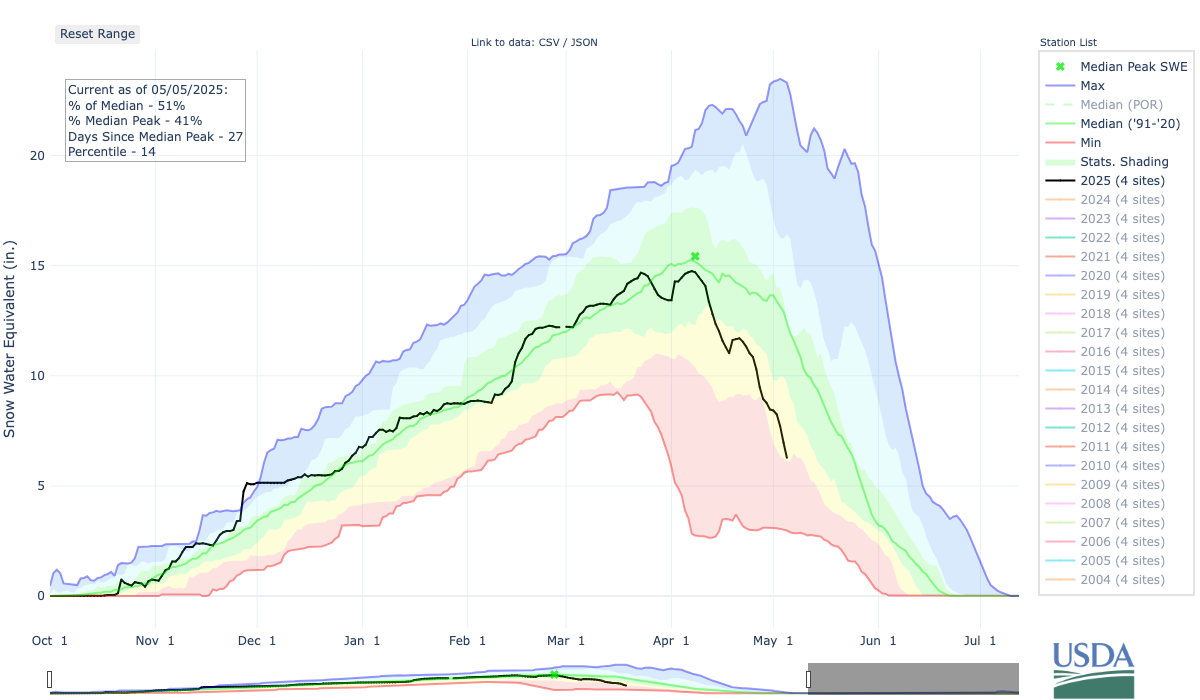
Snow Water Equivalent
This snow season, Eagle County reached a peak snow water equivalent (SWE) of 14.7 inches, down from 16.8 inches last year and below the 30-year median of 15.4 inches. This is a fairly average period leading up to the peak median snowpack date. After we hit that peak median snowpack date, temperatures warmed and precipitation dropped, leading to a relatively fast snowmelt thus far, specifically at lower elevations.
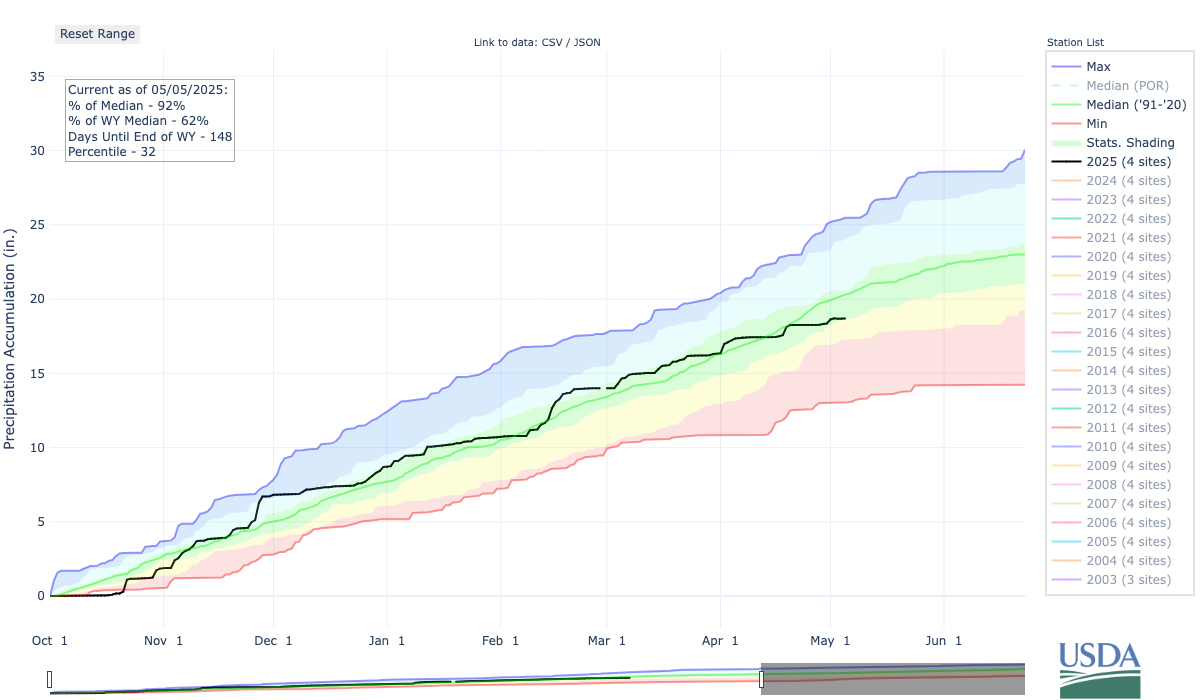
Total Precipitation
Precipitation remained at or slightly above average through most of the winter, up until April. One interesting insight from the seasonal precipitation plots is how clearly the major storm cycles stand out—they appear as sharp, steep increases. This highlights that precipitation doesn’t accumulate gradually or evenly over the season; instead, it comes in fits and spurts. This pattern is typical every year, not just this one, with a significant portion of our snowpack resulting from fewer than six major storm events. On the plot, you can identify these key cycles: 1) late October, 2) the Thanksgiving storm, 3) Christmas through the first week of January, 4) the Valentine’s Day storm cycle, and then three to four shorter, yet still notable, 1–2 day storm events in March and April.
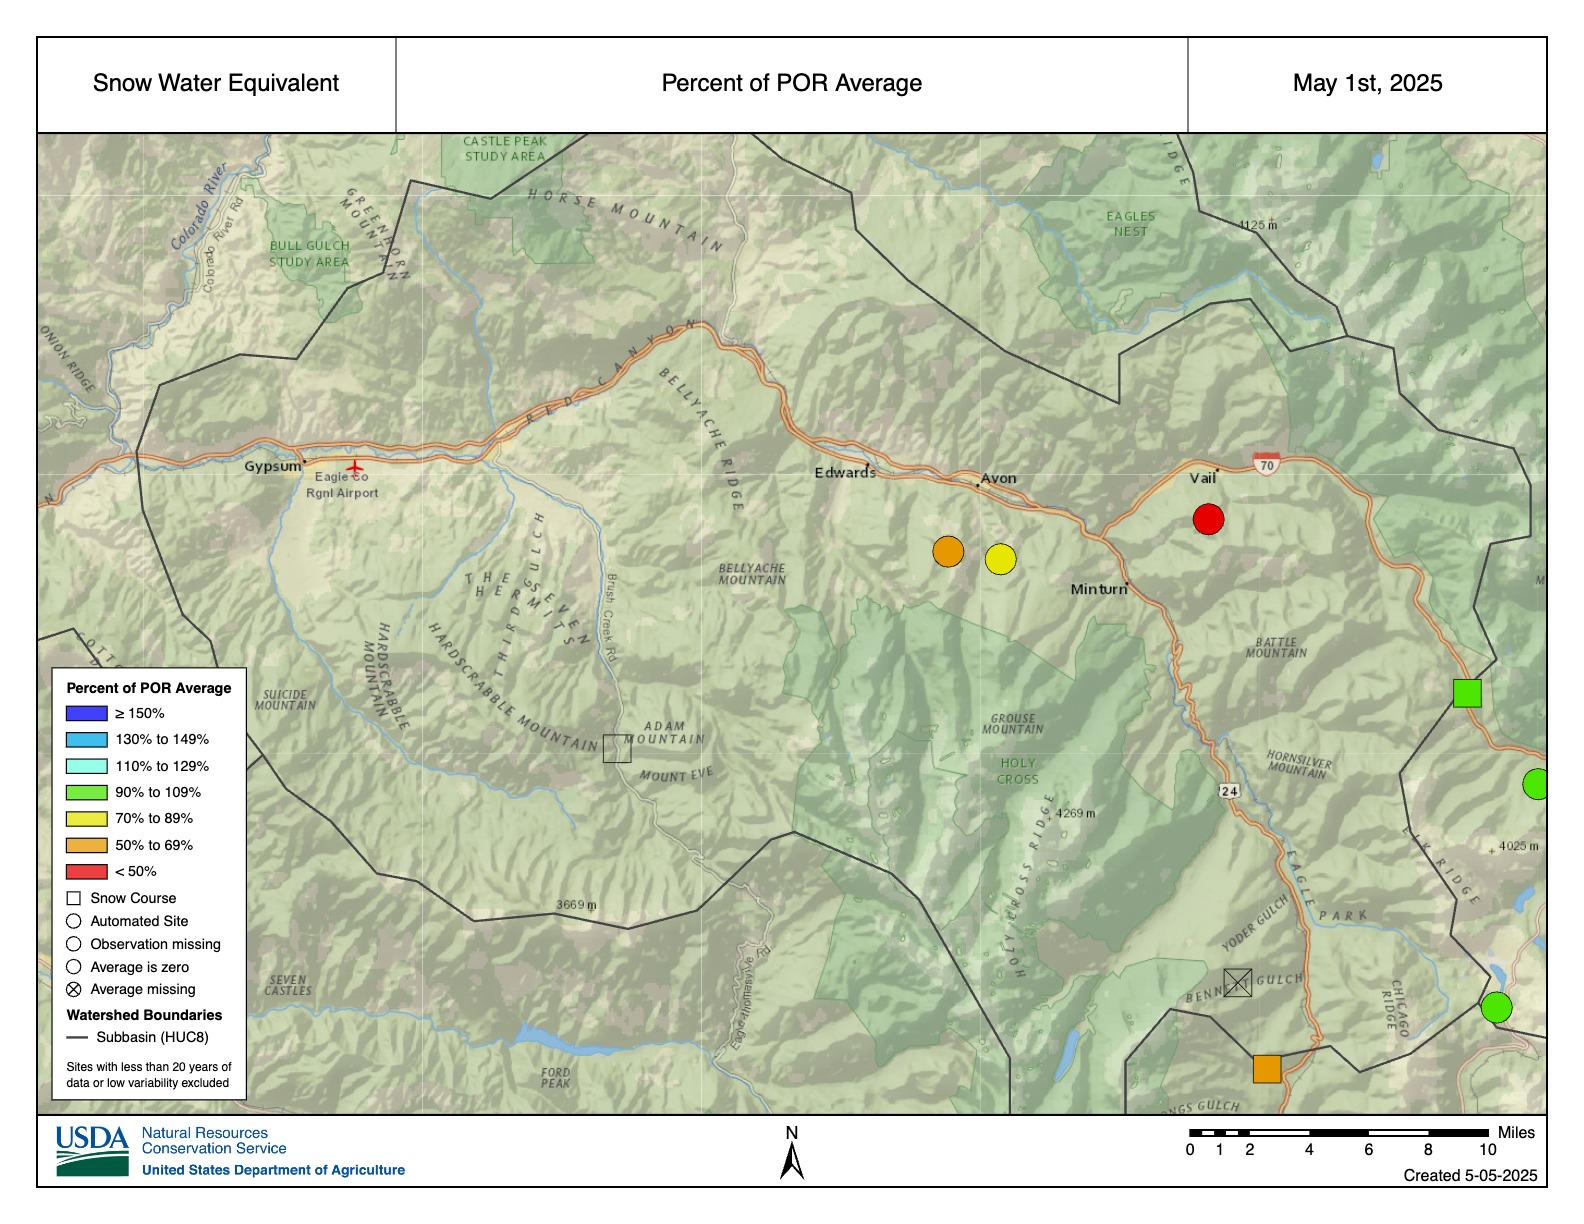
Snow Water Equivalent Based on Location
The map below displays snow water equivalent (SWE) levels across various elevations in the watershed. Lower-elevation sites—McCoy Park, Beaver Creek, and Vail Mountain—shown in orange, yellow, and red, are significantly below average. In contrast, higher-elevation sites like Shrine Pass and Fremont Pass (from bottom to top of the graph) are much closer to their historical averages.
Departure from Normal
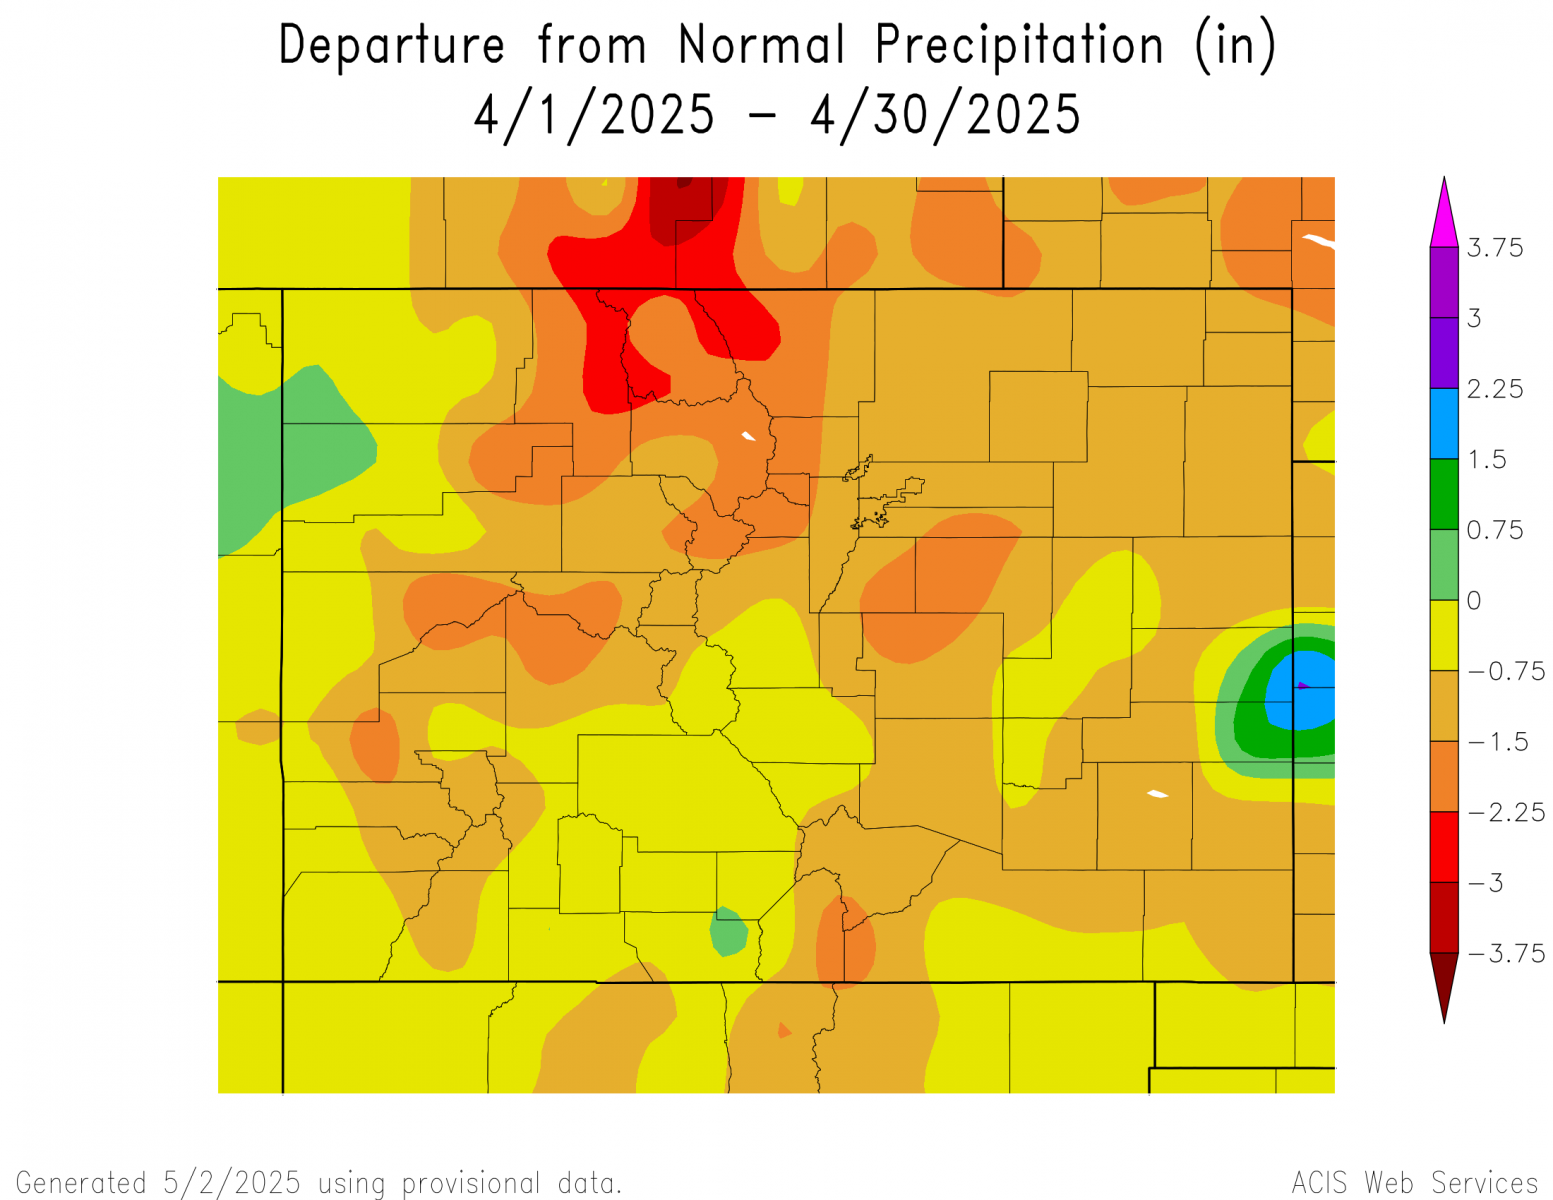
So what happened in April? The map below shows April precipitation across the state and its departure from average. April—typically one of our snowiest months—was significantly drier than normal across Colorado, including the Eagle River Watershed. This year, the ERW received just 2.1 inches of snow water equivalent (SWE) in April, well below the historical median of 3.5 inches.
Temperature
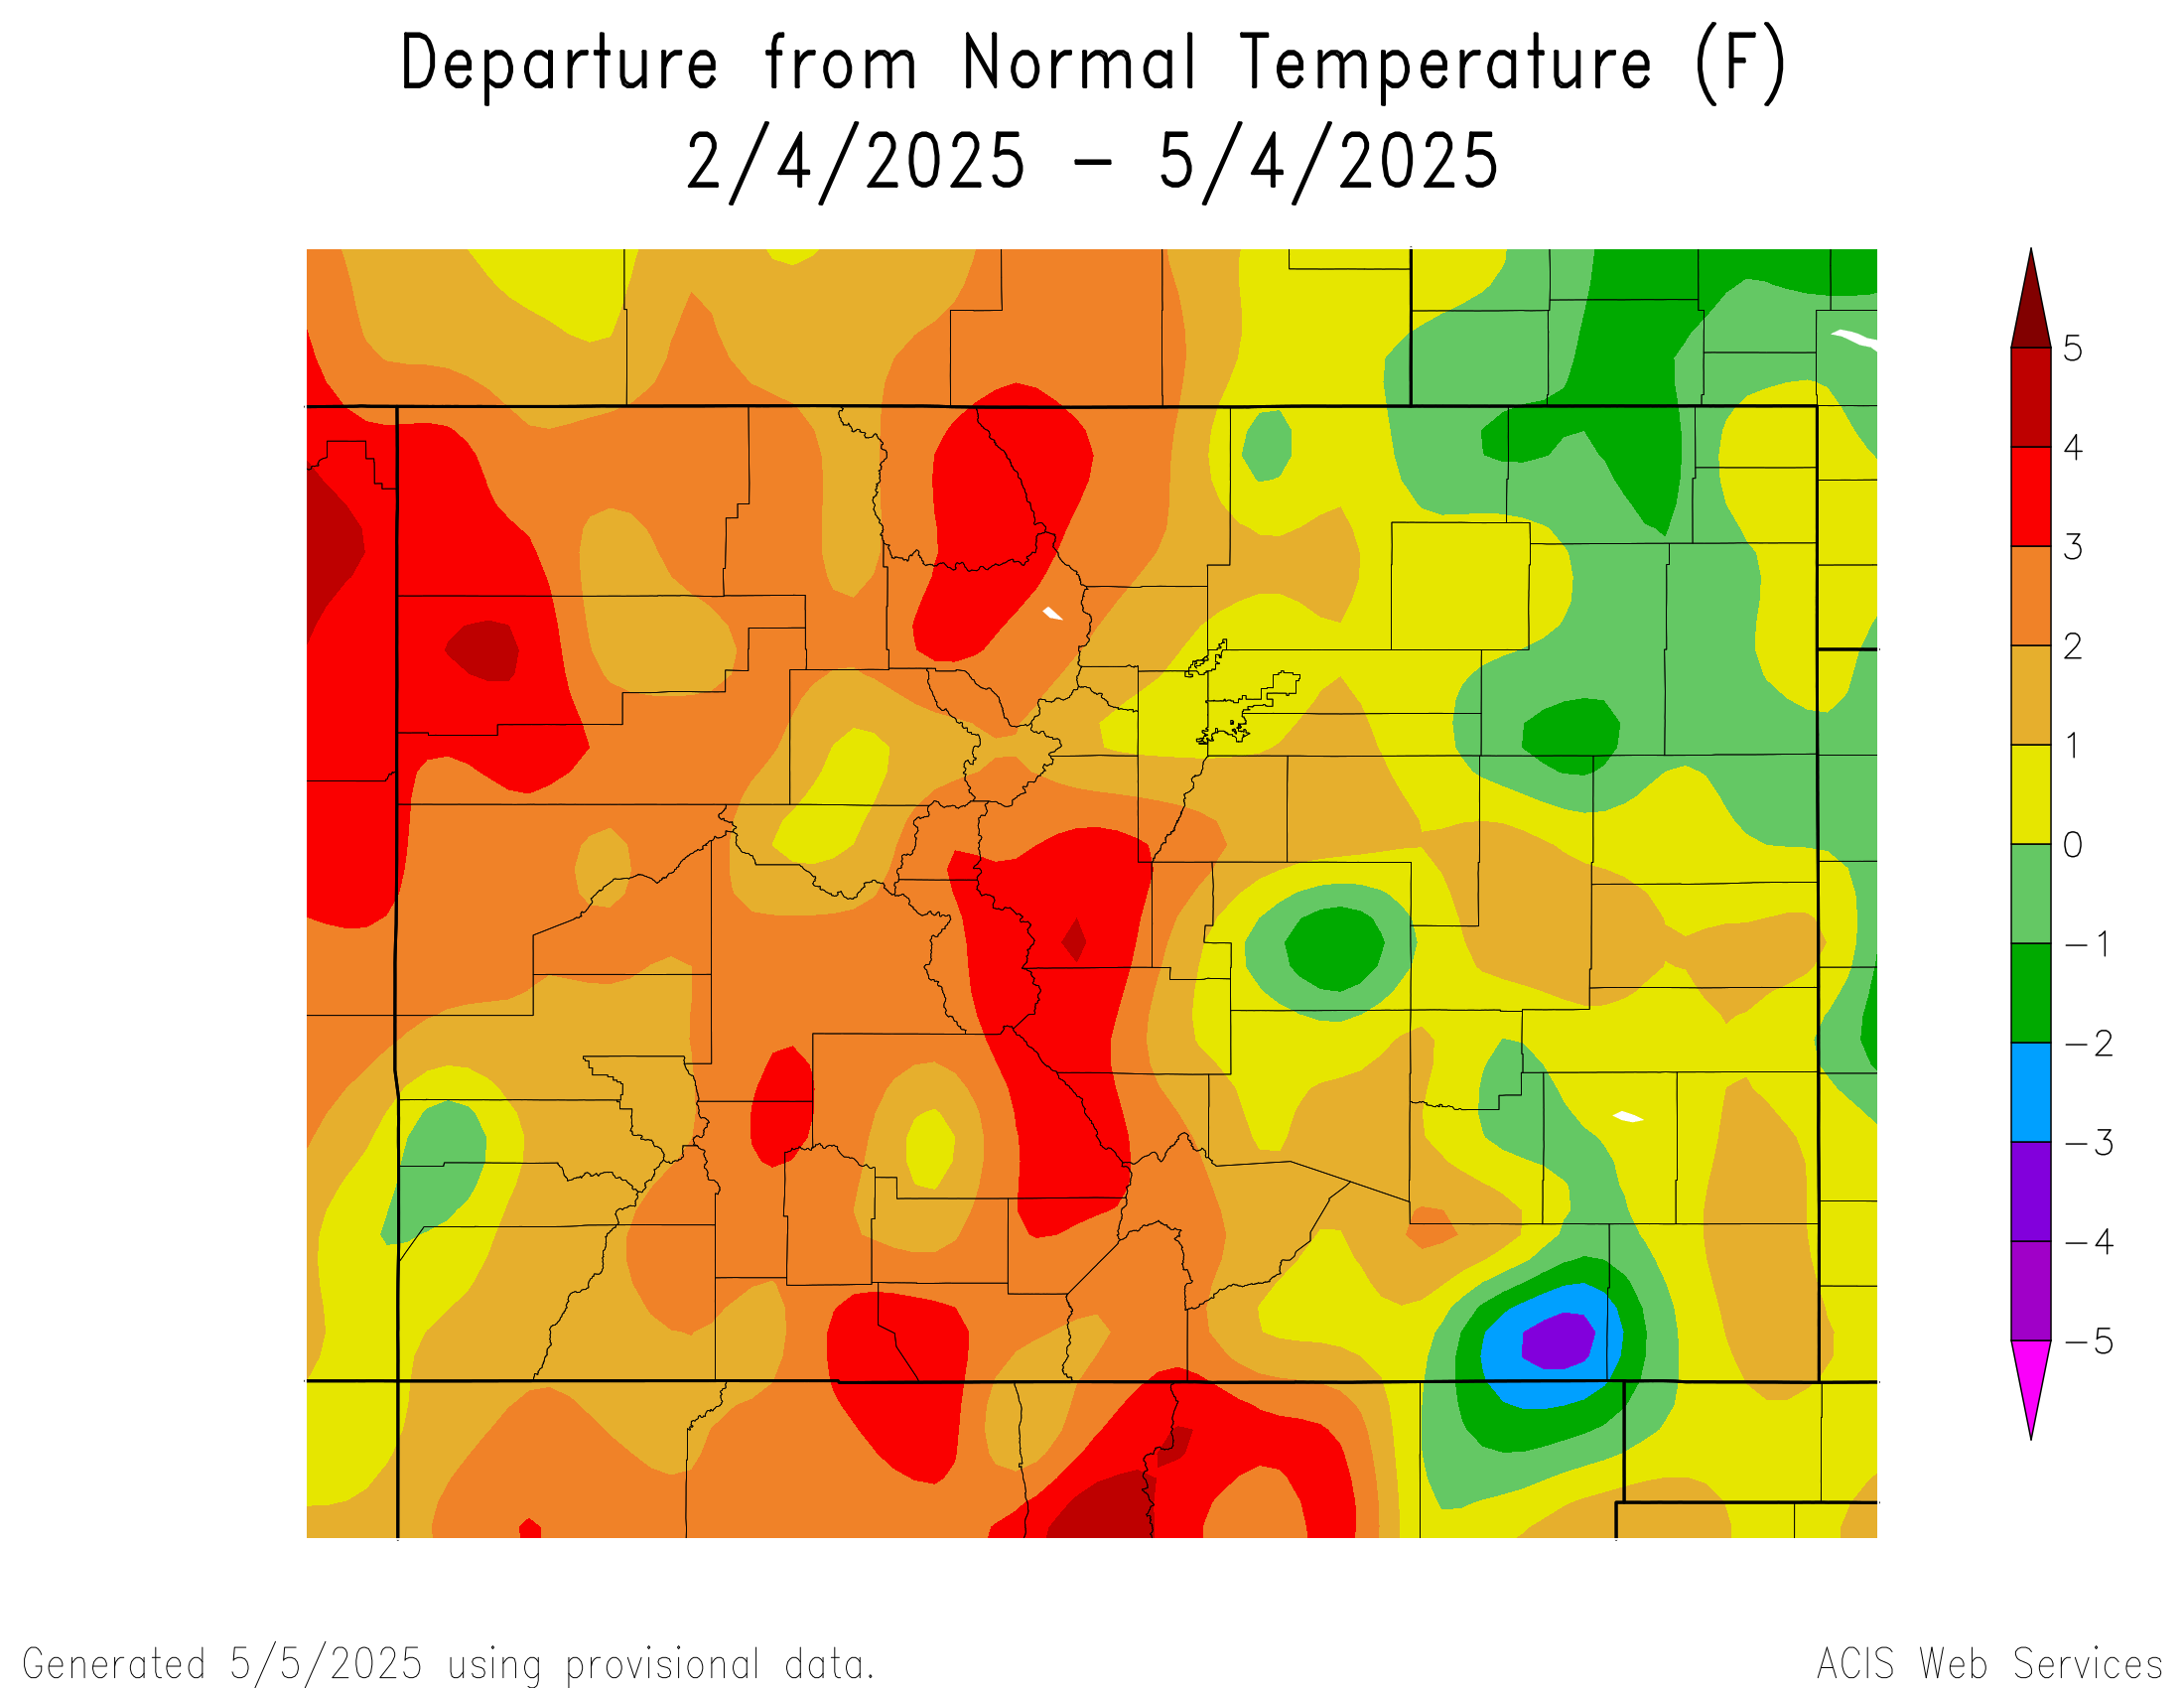
From February through the end of April, temperatures in Eagle County tend to fluctuate, but overall, it has been warmer than normal in Eagle County.
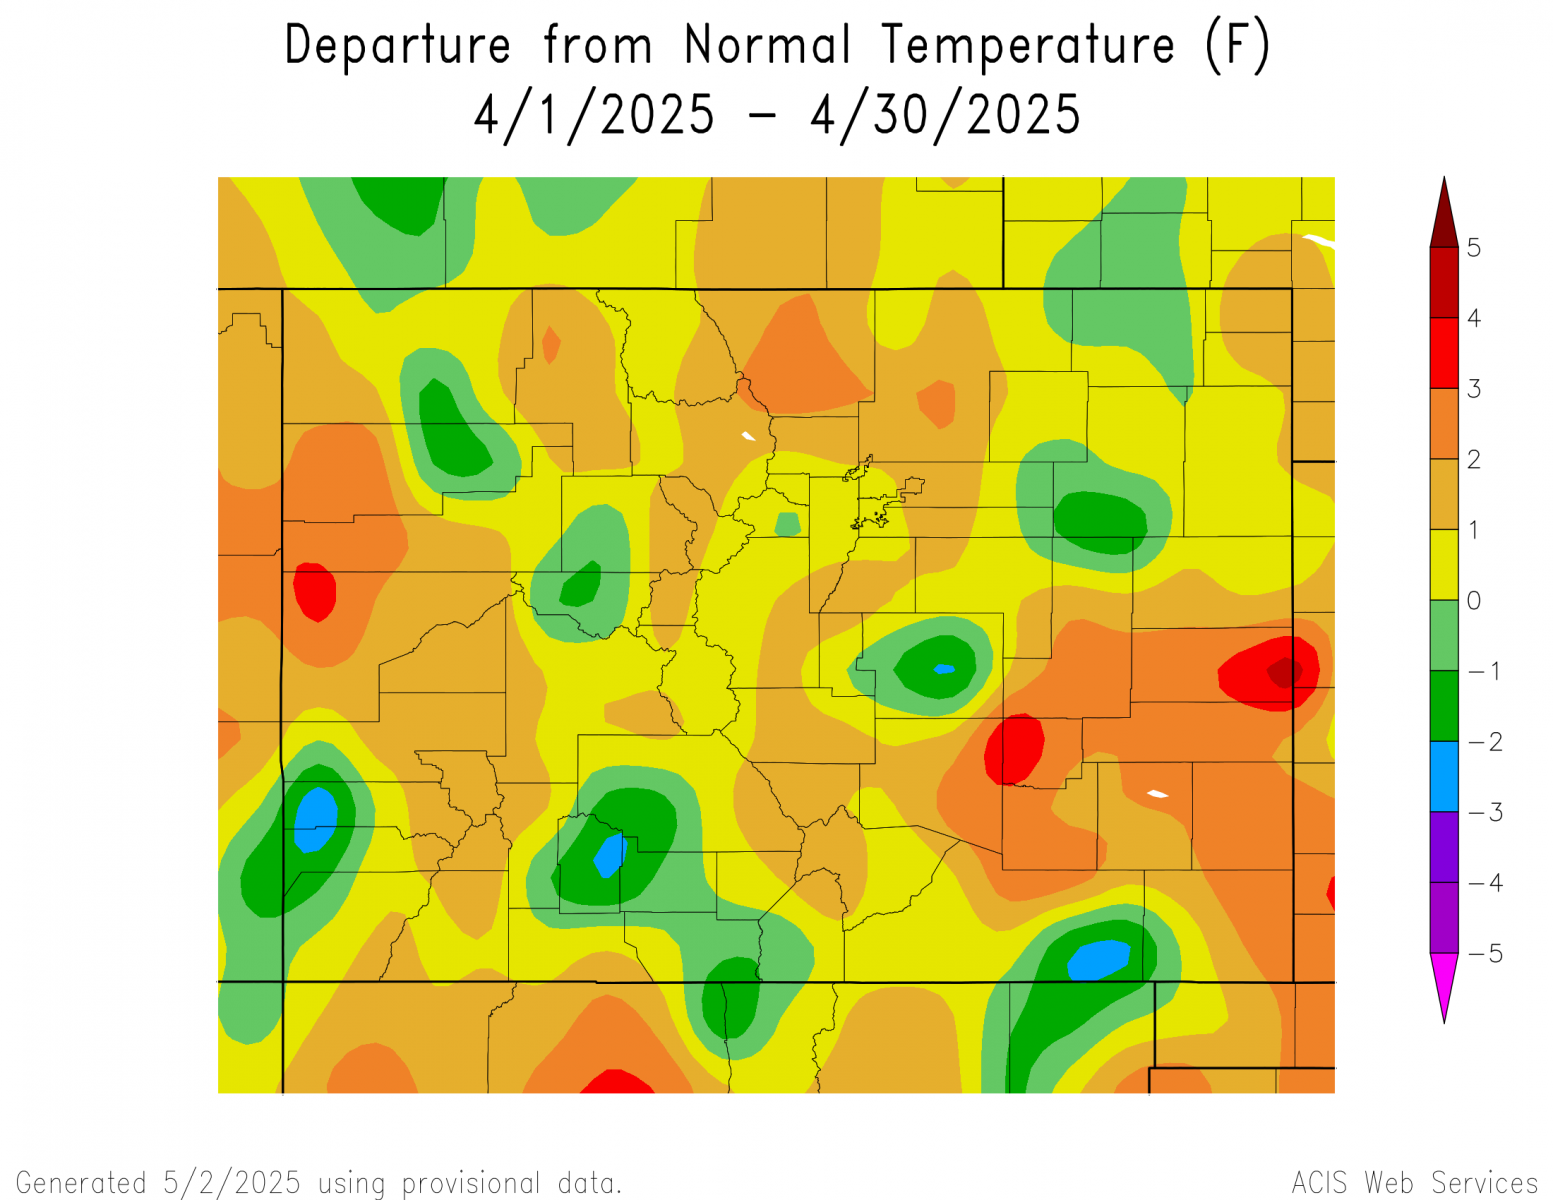
Once again, April proved to be a pivotal month. The map below shows temperature departures from normal, specifically for April. In the eastern portion of the Eagle River Watershed, temperatures were above average, while conditions in the western portion remained closer to normal. Again, below-average precipitation and above-average temperatures do not benefit our runoff.
Streamflow
So far, streamflow is following a similar trend to last year. However, it’s important to remember that we ended this season with over an inch less precipitation than last year. That means we can expect lower river flows. While the pattern may look familiar, it’s not necessarily a good sign—there’s simply less snow available to melt into our waterways.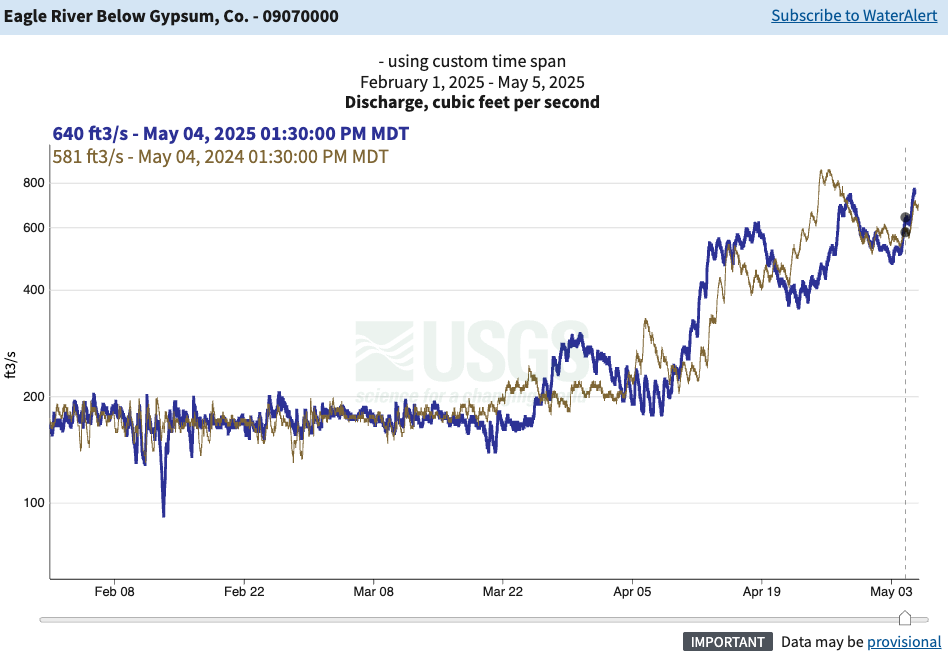
Blue – Current Year | Brown – Last year
Future Conditions
A portion of Eagle County has entered drought conditions for the first time in over a year. From January through April, we’ve received nearly an inch less precipitation than the 30-year historical median.
The two maps below show the likelihood of temperatures and precipitation being above or below the historical average. For the Eagle River Watershed (ERW), forecasts indicate a higher probability of warmer-than-normal temperatures and below-average precipitation for May and June.
Conclusion
Why does this matter? Nearly 80% of the water that sustains our rivers, communities, and ecosystems originates from winter snowpack, making it critical to understand how this season’s conditions will shape the coming months. Although the Eagle River Watershed (ERW) finished the winter near the 30-year median for snow water equivalent (SWE), an unusually warm spring has heightened the risk of rapid snowmelt and potential drought. Warm spells have already triggered two early rises in river flows, but as of early May, levels remain close to normal.
Looking ahead, Gore Creek is expected to see an earlier and weaker peak based on data from the Vail Mountain SNOTEL. In contrast, the Fremont Pass and Copper Mountain SNOTEL sites—more indicative of conditions in the upper Eagle—are closer to average, suggesting that a meaningful amount of snowpack remains to contribute to runoff in that region.
Fortunately, soil moisture levels in Eagle County were in decent shape at the end of 2024. This is encouraging, as more of the melting snow can now replenish groundwater and reach rivers, rather than being absorbed into dry soils.
However, the outlook is less favorable in the Arkansas Basin, where conditions are well below average. This could have implications for transmountain diversions, which depend on runoff from both the Colorado River and Arkansas River basins to fill reservoirs. In dry years like this, pressure on the Eagle River to supply water across the divide increases.
Important Terms & Sources
Terms:
30-Year Average: When presenting ‘average’ data, we compare current values to the medians for that same time over the past 30 years. This 30-year running average provides a long-term benchmark to help assess how current conditions stack up against historical norms. We are currently in the 1991 – 2020 average.
Snow Water Equivalent (SWE): is how much water is present when the snow is melted down. The primary reason this value is measured based on liquid water, rather than snow, is because the measurements for water are consistent, while the density of snow can vary widely. Click here to learn more.
Eagle River Watershed (ERW): The Eagle River drains approximately 970 square miles (sq mi) west of the Continental Divide in central Colorado before flowing into the Colorado River.
Sources
National Oceanic and Atmospheric Administration
United States Department of Agriculture
Natural Resources Conservation Service
Colorado Climate Center
Lotic Hydrology